Most n8n deployments start the same way: one container, SQLite, a handful of workflows, and it works beautifully.
Then someone wires up a webhook that receives a few hundred events a minute, or an AI agent workflow that spends ninety seconds waiting on model responses, and the whole thing falls over. Executions that took two seconds start taking four minutes. The editor gets sluggish. Webhooks time out.
The instinct at that point is to get a bigger server. That instinct is wrong, and understanding why is the difference between a system that scales and one that just costs more.
Why “autoscaling” on most hosts doesn’t help
A lot of one-click hosting platforms advertise autoscaling. Read the documentation and you’ll usually find they mean vertical autoscaling: the platform watches CPU and RAM on your instance and allocates more of both, up to some ceiling.
For a web app, that’s genuinely useful. For n8n running in its default mode, it’s close to useless, because n8n in single-process mode is one Node.js event loop. It handles the UI, the API, the triggers, the webhooks, and every workflow execution in the same process. Giving that process sixteen cores doesn’t make it run sixteen workflows in parallel. You’ve bought headroom for a bottleneck that isn’t CPU-shaped.
What you actually need is more processes pulling work off a queue. That’s a different axis entirely, and vertical autoscaling can’t reach it.
Queue mode: what actually changes
Queue mode splits n8n into distinct roles that scale independently.
- Main serves the editor and API, runs timers and polling triggers, and receives webhooks. It generates executions but doesn’t run them.
- Workers pull execution IDs off a Redis queue, fetch the workflow from Postgres, run it, write results back, and report completion.
- Webhook processors (optional) accept inbound webhook traffic so a burst of requests can’t compete with the editor for resources.
- Redis acts as the message broker using the Bull queue library. Postgres is the system of record.
Three constraints are worth knowing before you commit:
- Postgres is required. Running queue mode on SQLite isn’t supported. This is not a soft recommendation.
- Filesystem binary data isn’t supported in queue mode. If your workflows persist binary data, you need external storage, S3 or Azure. Workers and the main instance are separate processes, potentially on separate machines, and a local disk isn’t shared between them.
- Every process needs the same encryption key. The
N8N_ENCRYPTION_KEYfrom the main instance must be set on every worker and webhook processor, or workers can’t decrypt credentials from the database.
The minimum configuration looks like this:
export EXECUTIONS_MODE=queue
export N8N_ENCRYPTION_KEY=<shared_key>
export QUEUE_BULL_REDIS_HOST=redis
export QUEUE_BULL_REDIS_PORT=6379
Then start workers with n8n worker, as many as you need.
The signal that matters
Here’s where most autoscaling setups quietly fail.
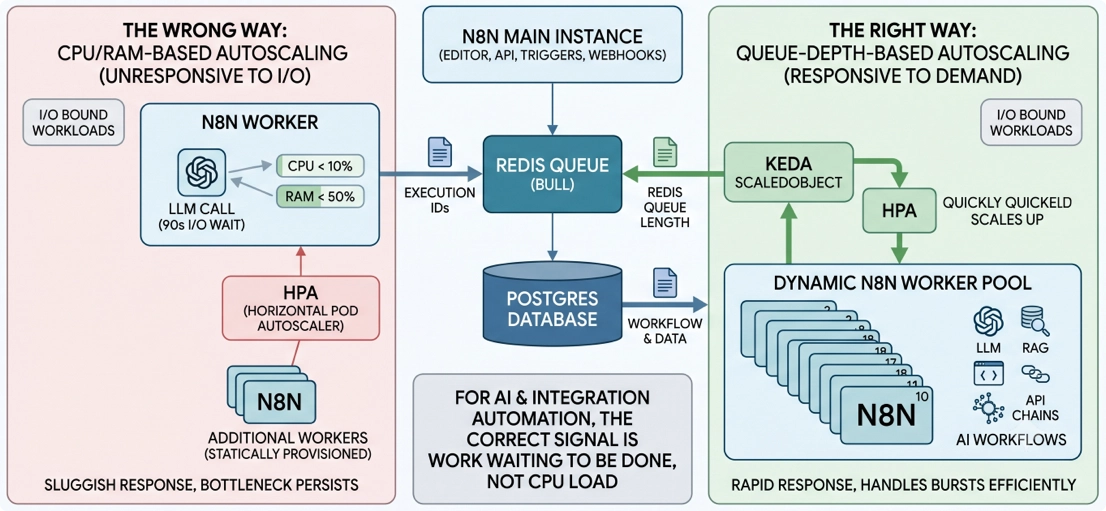
The obvious move is to put workers behind a horizontal pod autoscaler or a platform’s built-in autoscaling and target CPU utilization. This is what nearly every managed platform offers, and for n8n it’s the wrong metric.
n8n workers running AI and integration workflows are overwhelmingly I/O-bound. A worker executing a chain of LLM calls, CRM lookups, and HTTP requests spends most of its wall-clock time waiting on someone else’s server. CPU sits low. Meanwhile the Redis queue can be two hundred jobs deep and climbing, and a CPU-target autoscaler adds nothing, because by its measure everything is fine.
n8n’s own documentation is blunt about this. The built-in HPA scales workers on CPU utilization; for queue-based workloads, KEDA can scale workers on Redis queue length, which is more responsive to actual demand.
Queue depth is the metric. It’s the only one that directly represents “work waiting to be done.”
Wiring it up
n8n now publishes a first-party Helm chart, which makes this dramatically less work than it used to be. It supports queue mode, multi-main HA, webhook processors, task runners, HPA, pod disruption budgets, network policies, and S3 storage.
helm install n8n oci://ghcr.io/n8n-io/n8n-helm-chart/n8n -f my-values.yaml
Queue mode is the default, and the chart deliberately doesn’t bundle Postgres or Redis, you bring managed versions of both, which is what you want in production anyway.
KEDA is a first-class option. Setting keda.enabled replaces the built-in CPU-based HPAs with KEDA ScaledObject resources:
keda:
  enabled: true
  worker:
    minReplicaCount: 2
    maxReplicaCount: 20
    triggers:
      - type: redis
        metadata:
          listName: "bull:jobs:wait"
          listLength: "5"
KEDA has to be installed in the cluster separately. Worth understanding: KEDA isn’t an alternative to the horizontal pod autoscaler. It creates and manages an HPA on your behalf and feeds it external metrics through the Kubernetes External Metrics API. You’re not choosing between them, you’re choosing how queue depth reaches the autoscaler.
One caveat: the Bull list name depends on your queue configuration. n8n’s official examples occasionally use bull:default:wait, but the actual default queue name hardcoded in the application is jobs. Verify it against your actual Redis keyspace before you rely on it:
redis-cli LLEN bull:jobs:wait
If you’d rather scale on something n8n officially supports, enable the Prometheus queue metrics on the main instance:
export N8N_METRICS=true
export N8N_METRICS_INCLUDE_QUEUE_METRICS=true
That exposes n8n_scaling_mode_queue_jobs_waiting, a gauge counting enqueued jobs awaiting pickup, which you can feed to the autoscaler through the Prometheus adapter. Slightly more plumbing, but you’re scaling on a supported metric rather than a queue library’s internal key.
Choose the tier that matches your reality
Kubernetes isn’t the answer for everyone, and pretending otherwise is how teams end up paying a platform tax for capacity they never use.
- Single VPS, Docker Compose. For most workloads this is the right answer. Queue mode in Compose with a script that polls Redis queue length and scales worker containers gets you correct queue-depth scaling with no cluster. The ceiling is one machine, which is a real limit but a high one. Community projects exist that package this, including task runner sidecar handling.
- Managed PaaS with background workers. Platforms like Render can run n8n workers as autoscaling background services with managed Postgres and Redis alongside. Setup is trivial. The compromise is that these scale on CPU and memory, not queue depth, so tune concurrency low enough that CPU actually tracks load, enable the memory target too, and keep a minimum of two instances.
- Kubernetes with KEDA. Correct metric, real elasticity, scale to zero if you want it. On GKE Autopilot you get managed nodes on top of that. The setup is a project, but ongoing maintenance is genuinely low once it runs.
The tuning that decides whether it works
Concurrency before replicas. Worker concurrency defaults to 10. n8n recommends 5 or higher, because low concurrency across many workers can exhaust your database connection pool and cause delays and failures. Tune concurrency first via the N8N_CONCURRENCY_PRODUCTION environment variable or the --concurrency command flag, then let the autoscaler handle replica count.
Watch the Postgres connection pool. Every worker opens connections. Autoscaling from 2 to 20 workers multiplies that by ten, and the failure mode looks like mysterious execution delays rather than an obvious connection error. If you plan to scale high, put a connection pooler like PgBouncer or RDS Proxy between your workers and Postgres.
Graceful shutdown is not optional. This is the single most common way queue-depth autoscaling breaks in production, and it will not show up in testing. Scale-in on a queue-depth signal is aggressive by design: the queue drains, the autoscaler drops replicas, and any worker mid-execution gets terminated. N8N_GRACEFUL_SHUTDOWN_TIMEOUT defaults to 30 seconds. If your longest workflow runs for four minutes, you need that timeout above four minutes, and your Kubernetes terminationGracePeriodSeconds above that.
export N8N_GRACEFUL_SHUTDOWN_TIMEOUT=300
Test workflows finish in seconds, so this bug ships silently and surfaces later as executions that vanished without an error.
Scale webhooks separately. Webhook processors are a different axis and a legitimate CPU-scaling candidate, since they’re doing HTTP work rather than waiting on APIs. Route /webhook/* and /webhook-waiting/* to that pool, keep /webhook-test/* on main, and don’t put main in the load balancer pool, it’ll degrade the editor.
Multi-main requires Enterprise. Running more than one main process for high availability needs N8N_MULTI_MAIN_SETUP_ENABLED, sticky sessions, and a self-hosted Enterprise license. On Community, main is a single replica. Plan around it.
When not to do any of this
Autoscaling earns its complexity when load is genuinely unpredictable. A lot of automation isn’t, scheduled posts, hourly syncs, and batch jobs are bursty in known windows. Four fixed workers on a decent machine absorb an enormous amount of that, and the engineering you’d spend on elastic scaling buys nothing you’ll feel.
The honest test: look at your queue depth over a week. If it spikes at times you could have predicted from a calendar, provision for the peak and move on. If it spikes because a customer did something you didn’t anticipate, build the autoscaler.
Queue mode itself, though, is worth adopting well before you need autoscaling. The moment webhook latency starts climbing or a slow workflow blocks a fast one, splitting execution off the main process is the fix, whether you run two workers or twenty.